
Climate adaptation toolkit
Posted on .
To help kickstart a project proposal, I performed an ideation workshop to come up with ideas for a new touch enabled climate adaptation web app at Deltares.
Cities and neighbourhoods all over the world need to adapt to the changing climate. Heat stress and severe amounts of rainwater are tough challenges to cope with. The measures needed to change a neighbourhood towards a more climate resilient area and their effects on citizens are often difficult to explain and oversee for all parties involved.
Defining the holisitc product view
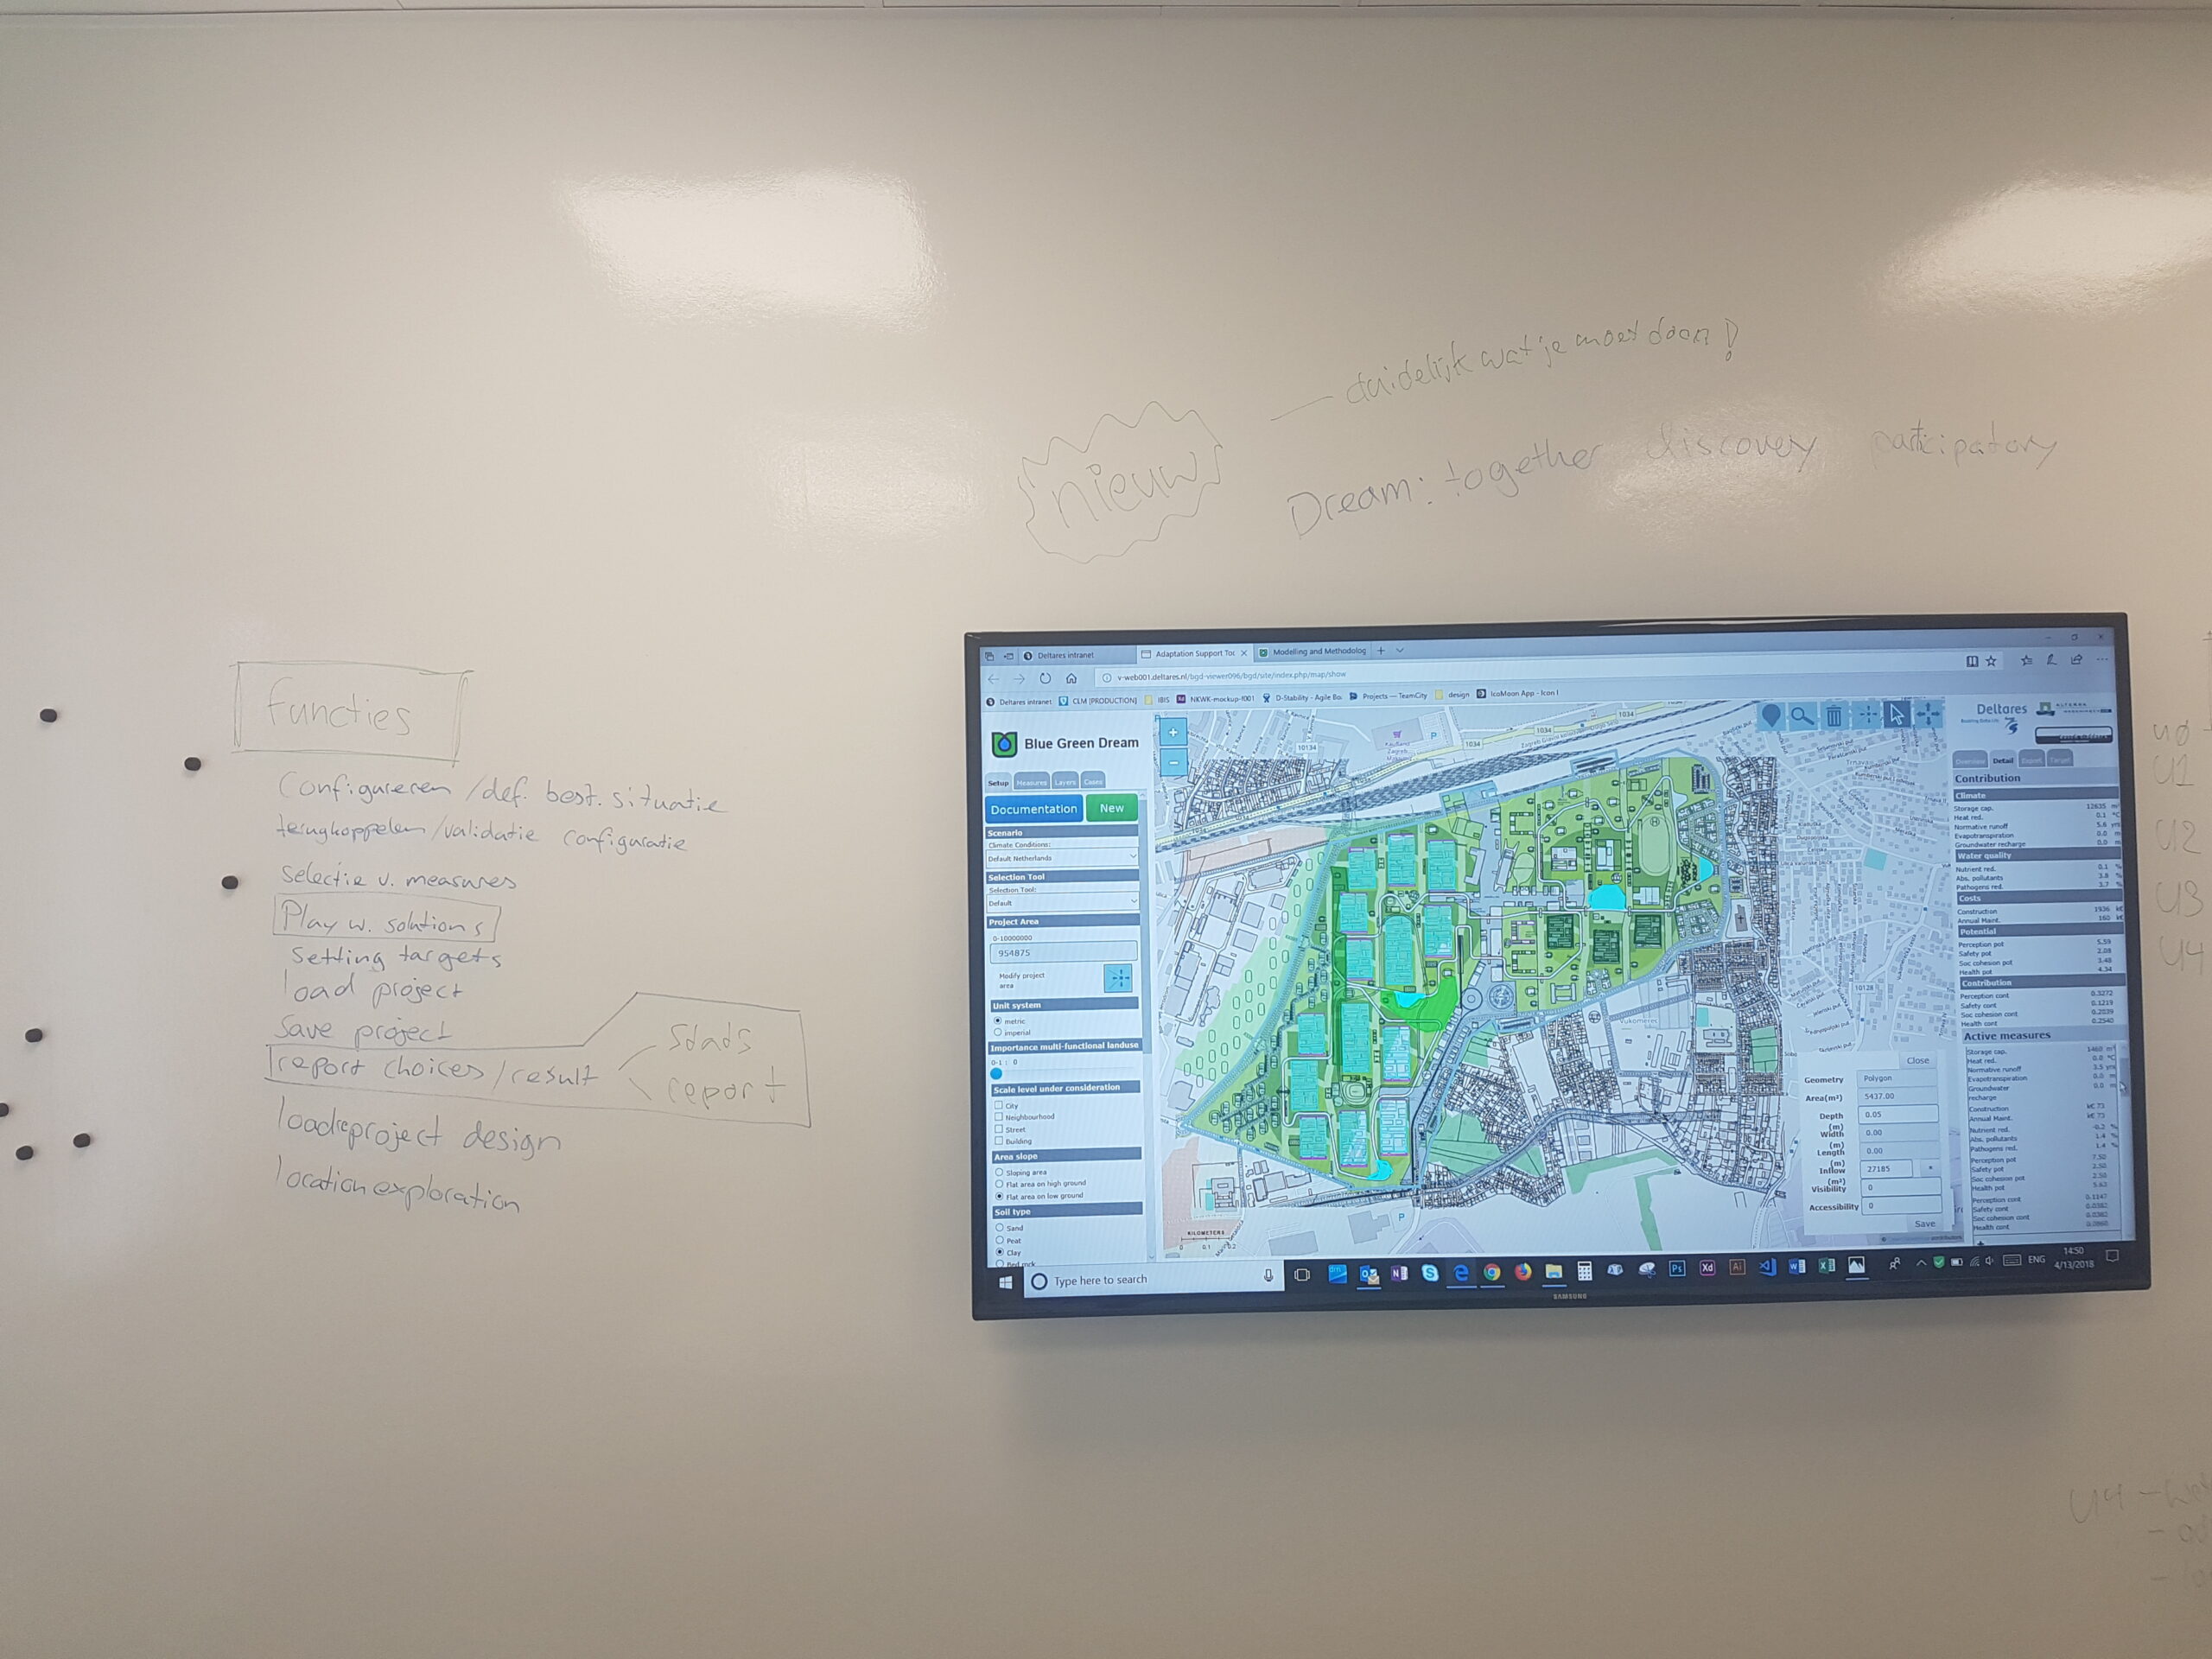
Before moving to the creative part of generating ideas for the interface of the web app, I wanted to set boundaries by setting a common goal and defining issues to be solved in the product. A huge whiteboard wall helped to do so having the reference product in the center on screen which allowed for annotations around it.
After defining a list of issues that the new product should fix or cope with, we easily visit all items during the creative brainstorm and check if solutions would meet the goals and boundaries.
Challenges for design
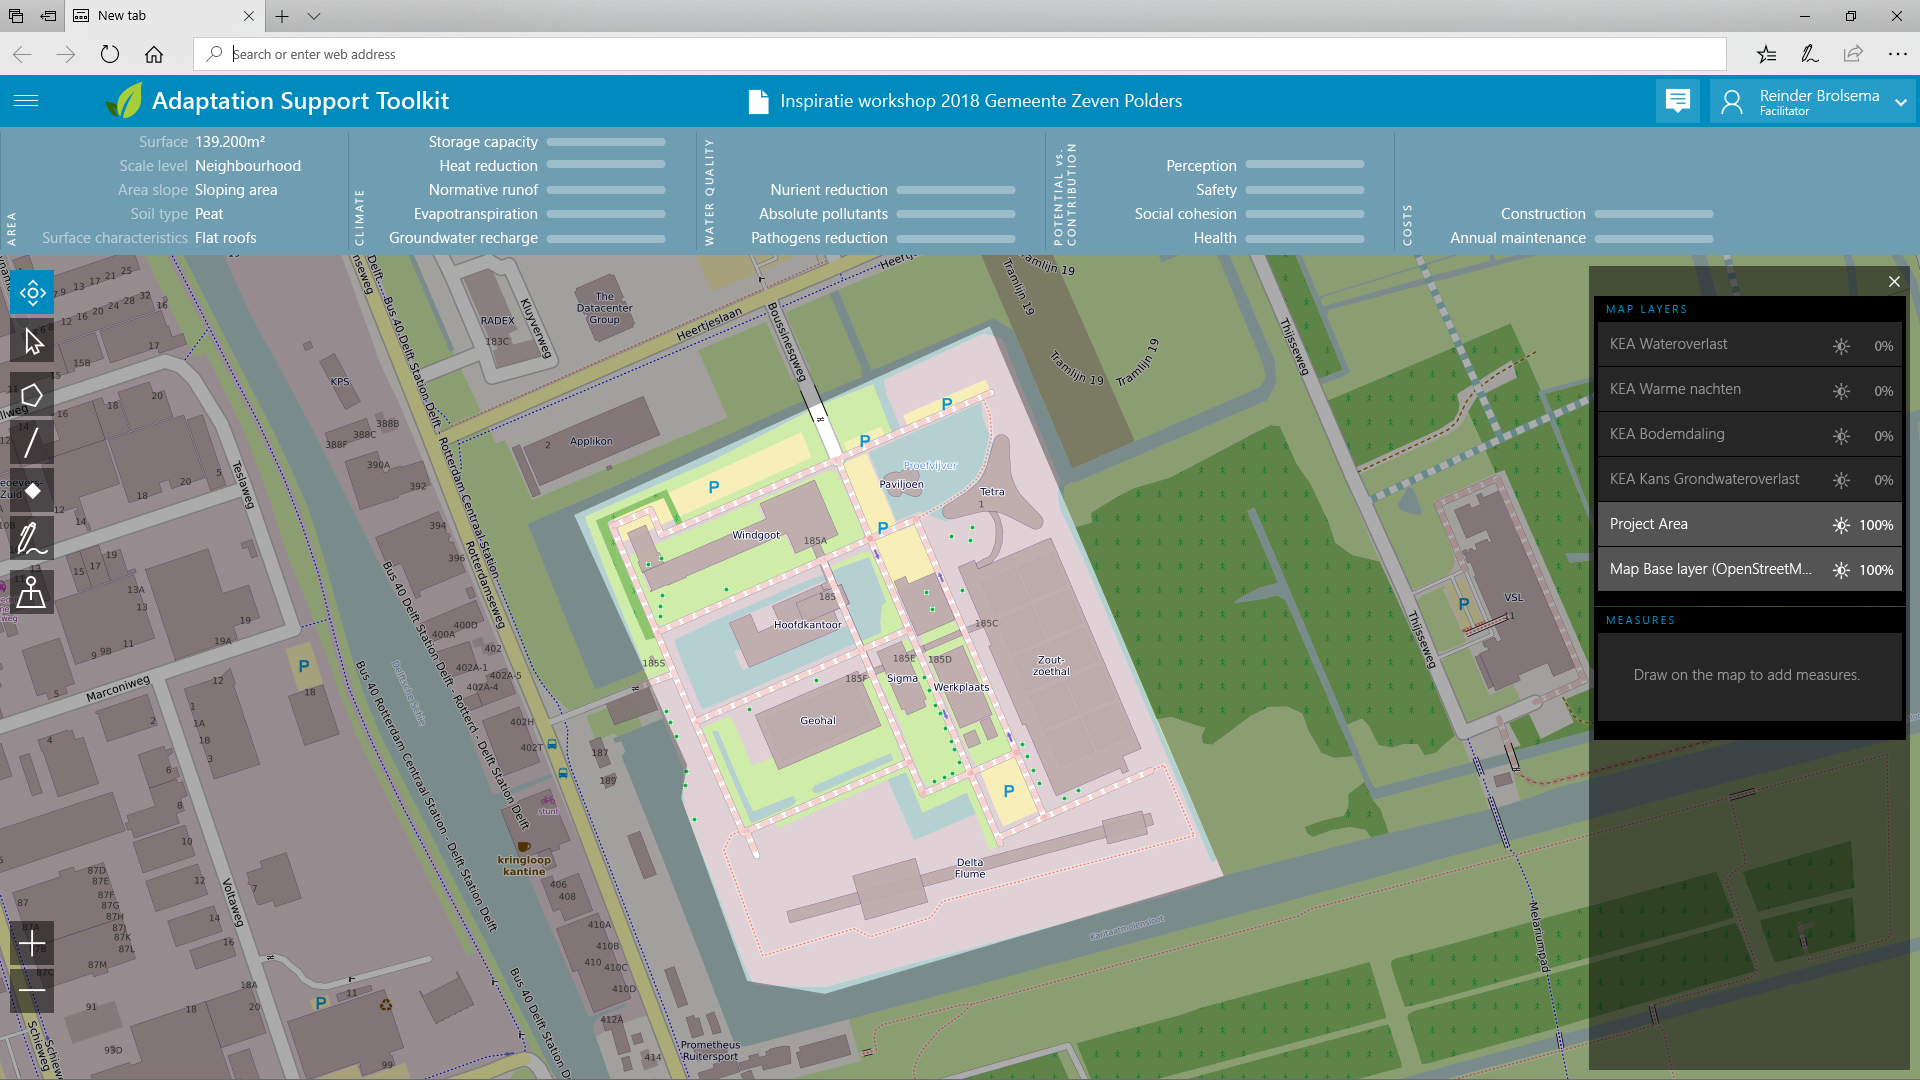
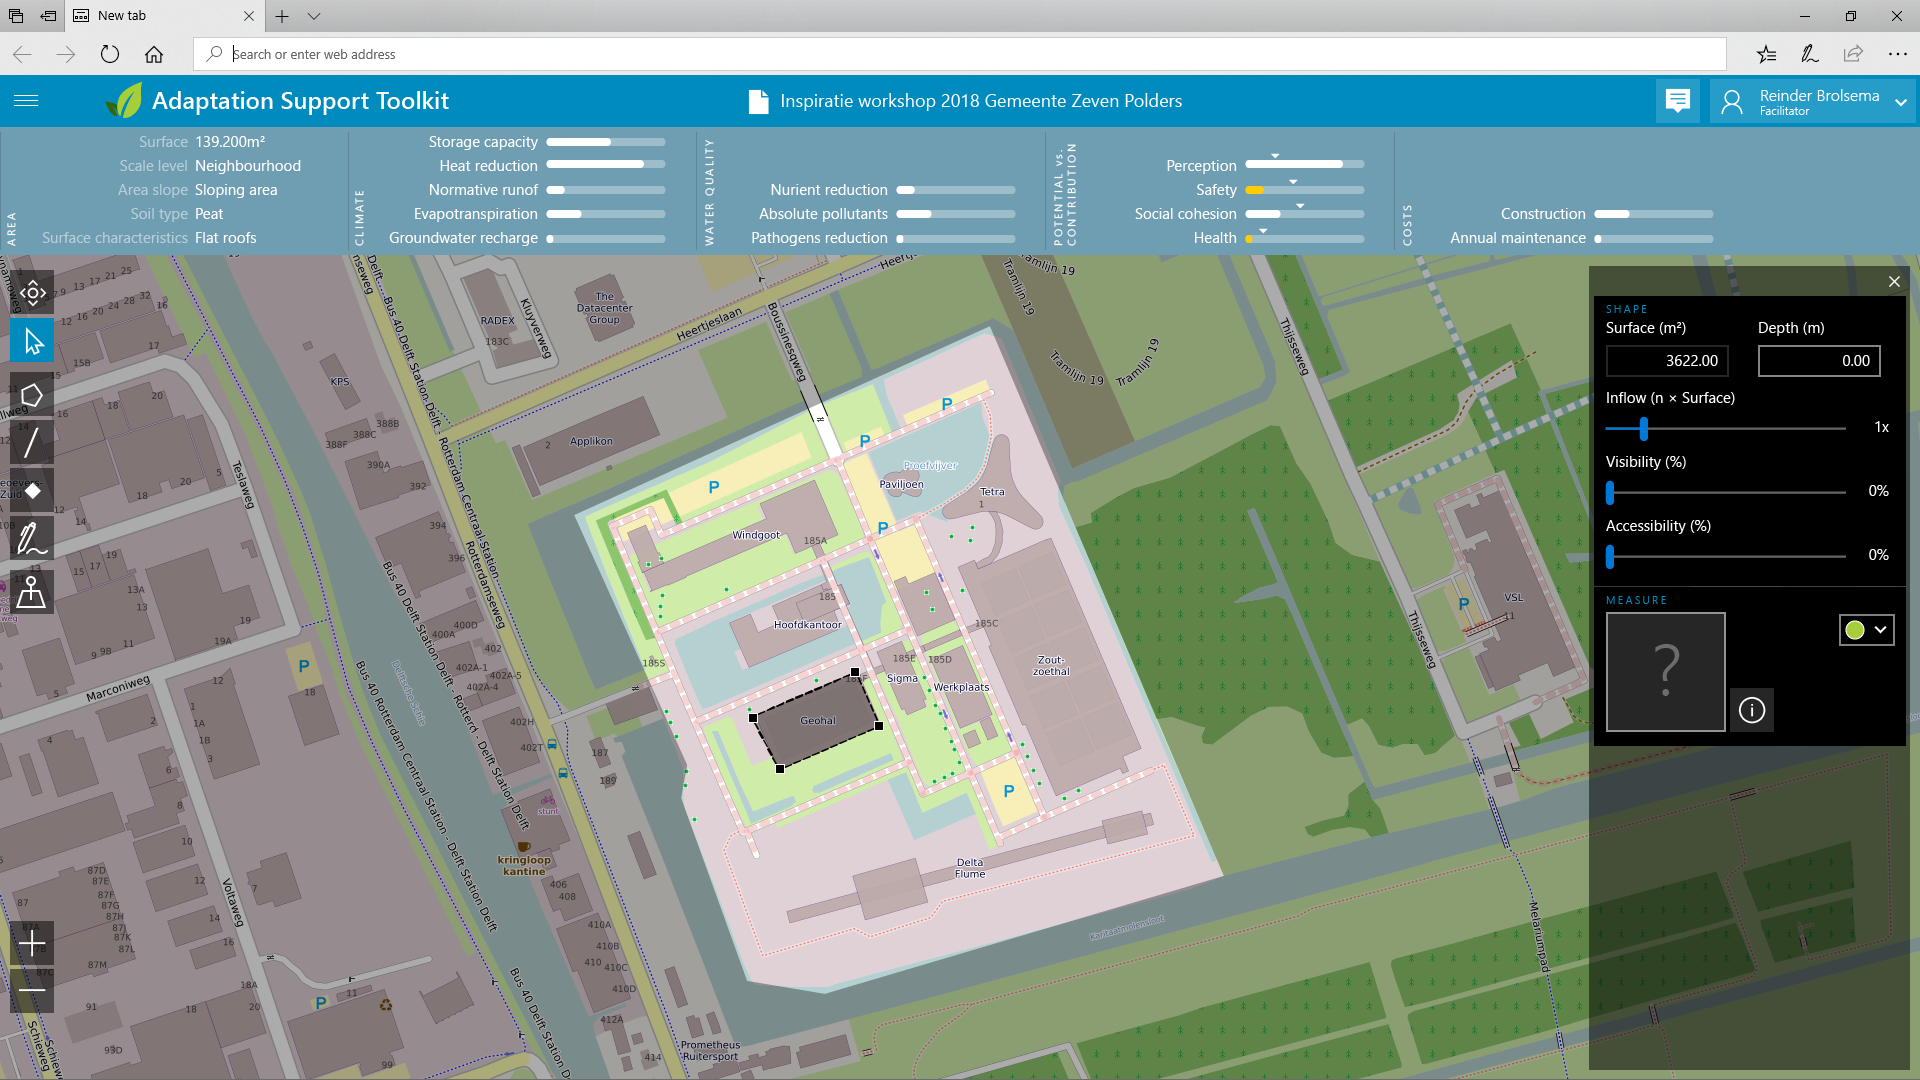
Products that use a map for data presentation and navigation are always a bit of a challenge especially when the interface needs to support both mouse and touch interaction. It helps to limit functionality and number of data contexts in one view.
The number of possible measures to mitigate climate related issues is a very large set. For a user to pick the right option (even guided by a professional/scientist) is hard. Therefore we came up with an interaction scheme that allows for exploration and trial-and-error design. As the support of touch interaction was a high valued requirement, we opted for a horizontal navigation pane to show the possible options. By realtime updating the effects on several parameters (positive or negative) a user could play with the amount of effect.
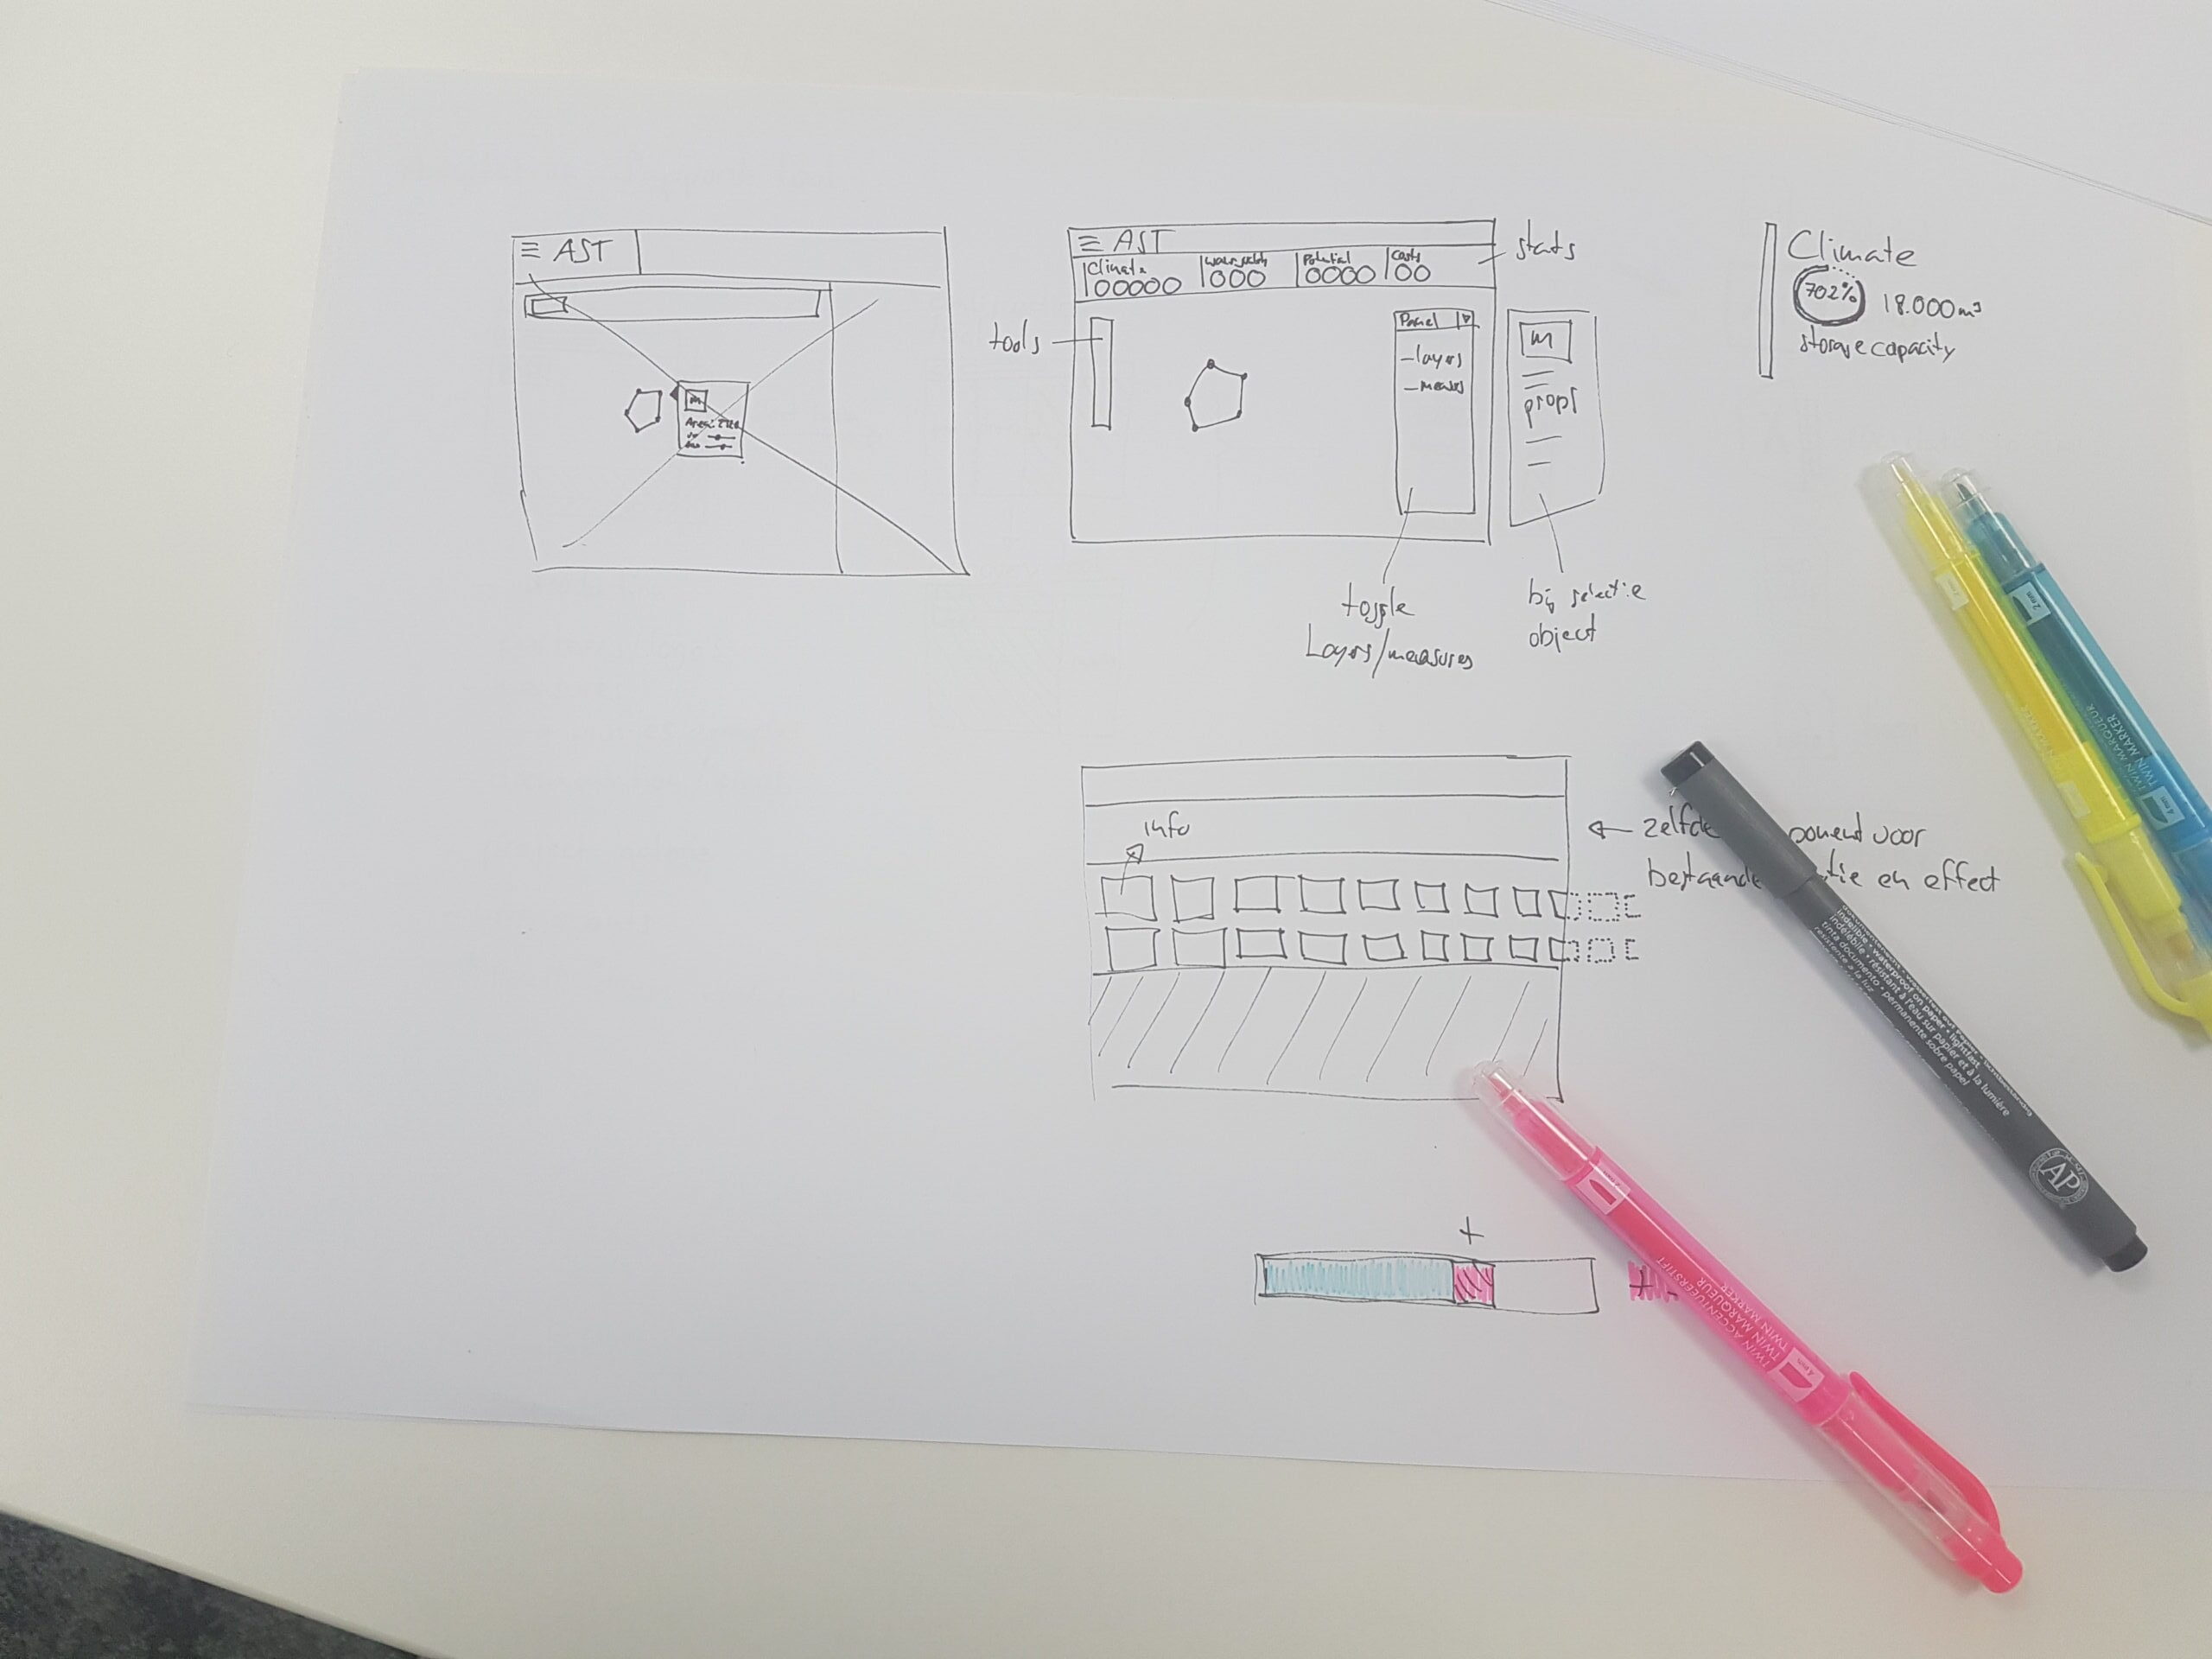
Digital sketching
To help the project proposal, I created a few digital sketches of the possible new product showing the findings from the workshop.
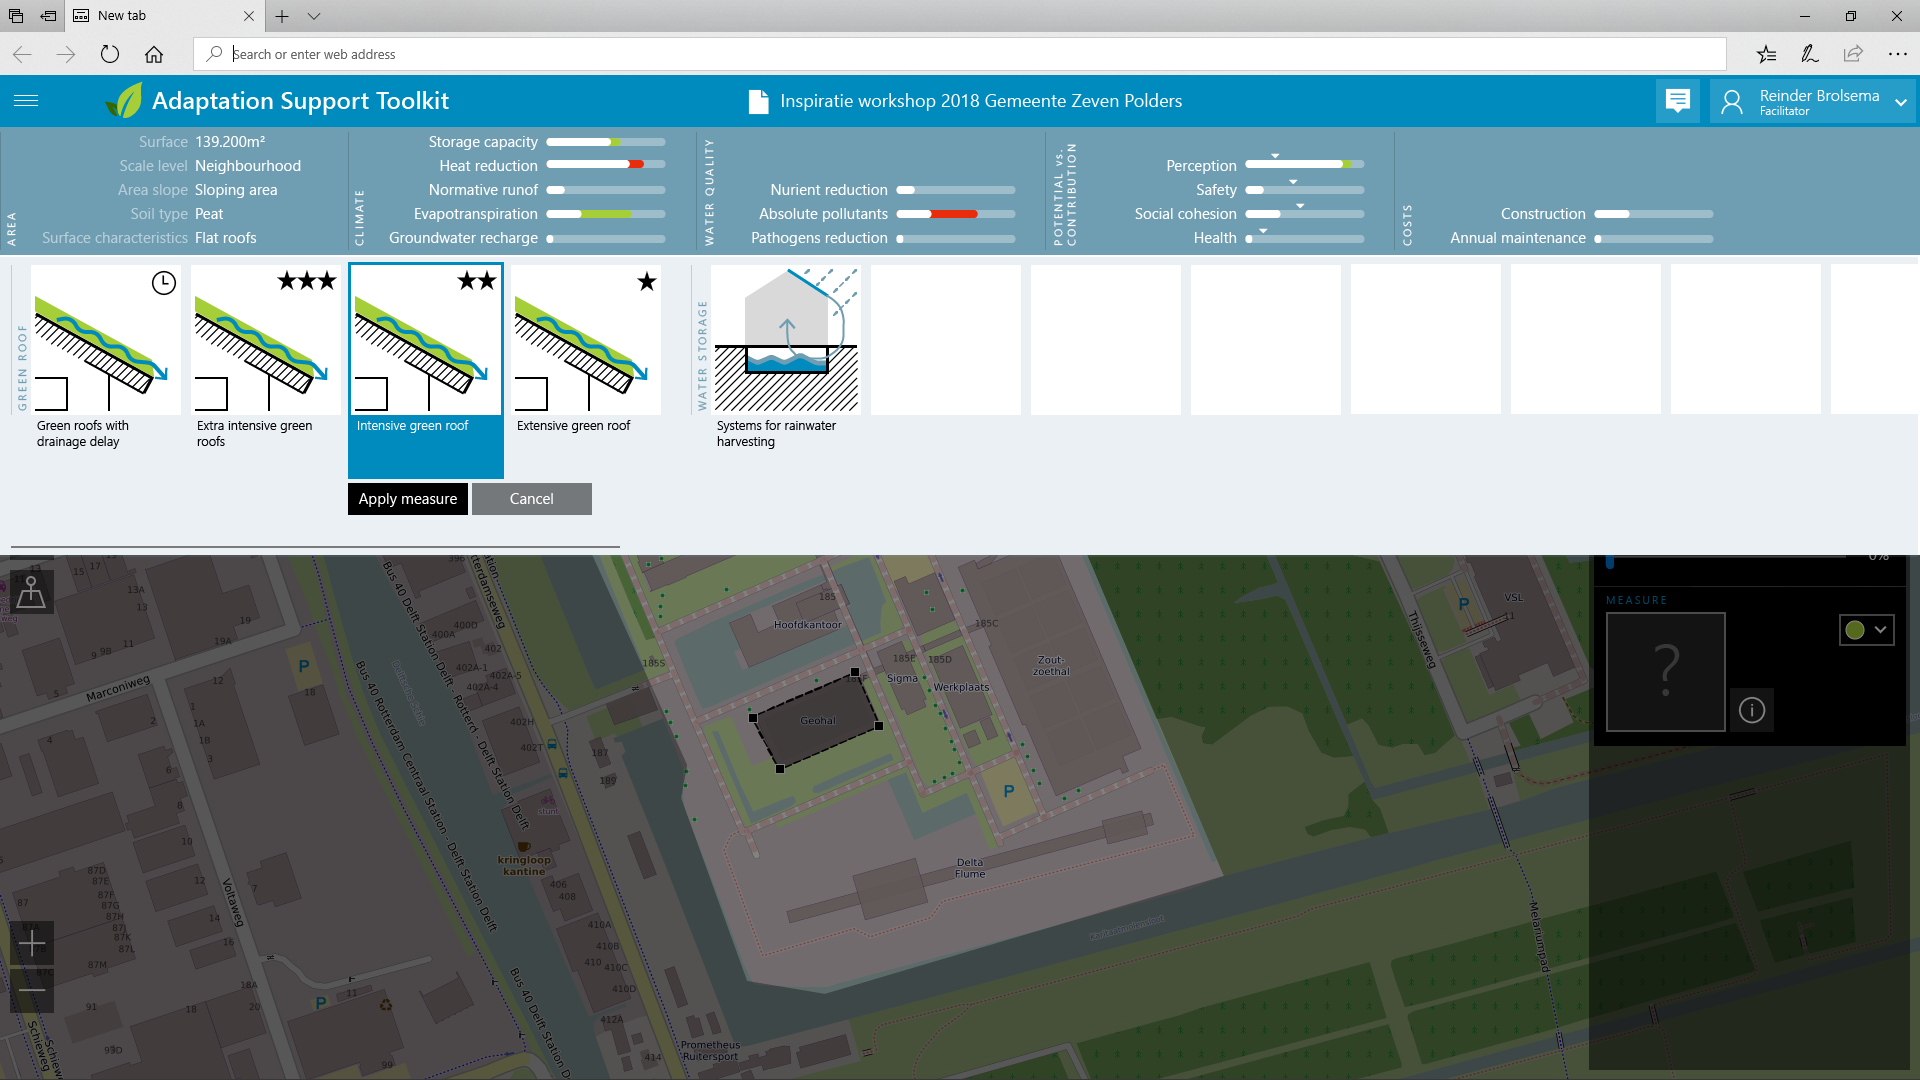
Outcome
My personal contribution to this project ended after the ideation workshop, but a few months later I was happy to see the project team took over a lot of design elements/ideas.